
Clicking a student’s name brings up all of their data from playing the games and taking the NIH tests.
Game Data:
Here are some of the terms you might see as you review their data:
- Overall Percentile– Percentile ranking of the student according to grade level in our global data base.
- Minutes Played– lets you know how far away they are from reaching the program goal of 1000 minutes
- Last Signed in- Provides you with the date this student’s last exercise session.
- Overall Progress graph: Shows you how this student’s progress across all the games compares with every other student of the same grade level in our database.
- Progress: This is the best indicator of how the student is progress in their exercises. Points are awarded to the student if they are able to master a level of the games.
- Success- Provides you with the percentage of times the student is able to master the levels of the games compared to when they plateau on a level.
- Average List Length Remembered: In Monkey Trouble and Grub Ahoy, students must remember lists of increasing length – this number represents the average sequence they could remember correctly in any given 5-minute game session.
- Percentile: How this student compares to every other student of the same grade level in these spatial working memory games.
- Longest List Length Remembered to Date: This is the longest list the student has correctly recalled in all spatial working memory game sessions to date.
- Average Memory Score graph: This graph shows the average list length remembered in each 5-minute session of spatial working memory games.
NIH Results:
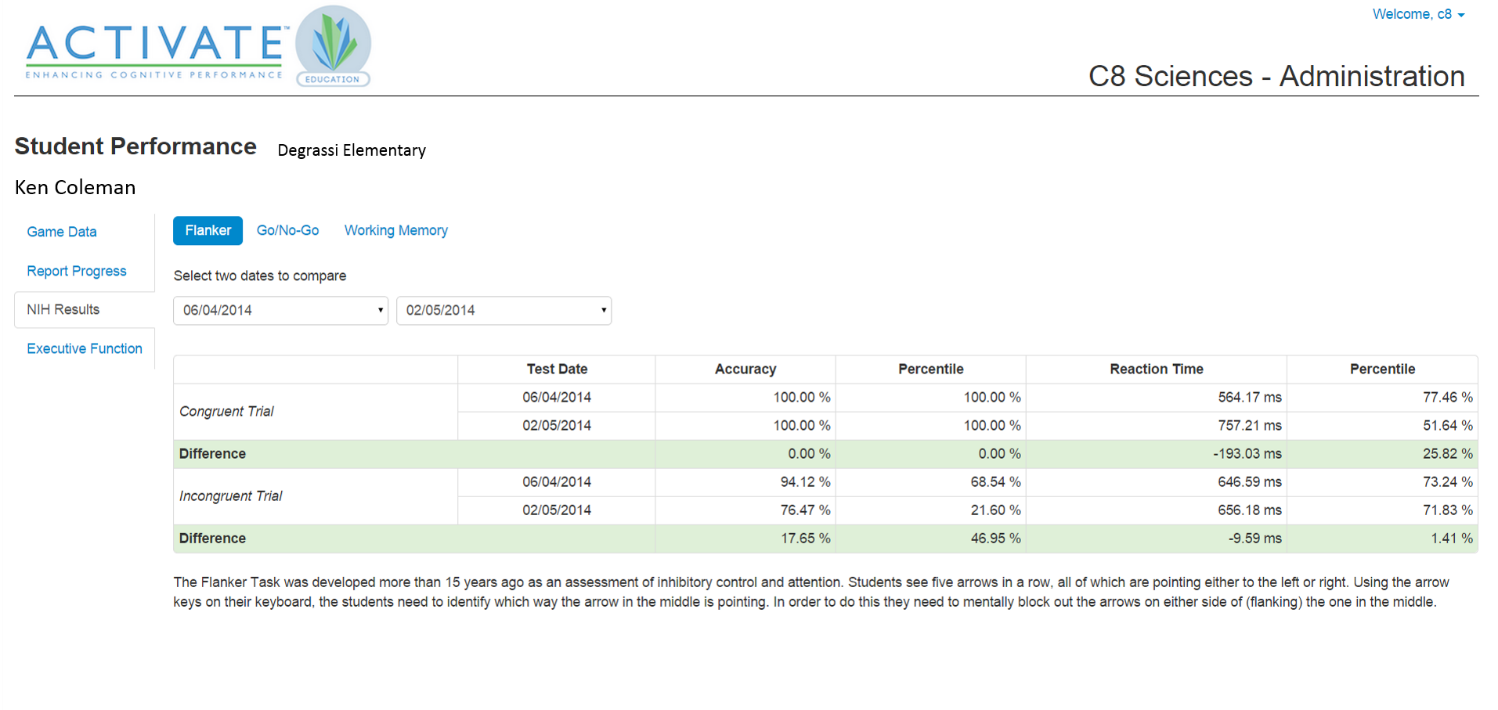
- Shows the pre-test scores on all 4 NIH cognitive toolbox tests along with the post-test scores and difference.
- Select the name of the test you want to view from Flanker, Go/NoGO, or Working Memory
- Select any two dates from the dropdown menu to compare results and view the difference.