
Learning Groups Overview:
Instructors can view all the Learning Groups they have created, track their Learning Groups’ progress, and retrieve data on student performance.
My Learning Groups view:
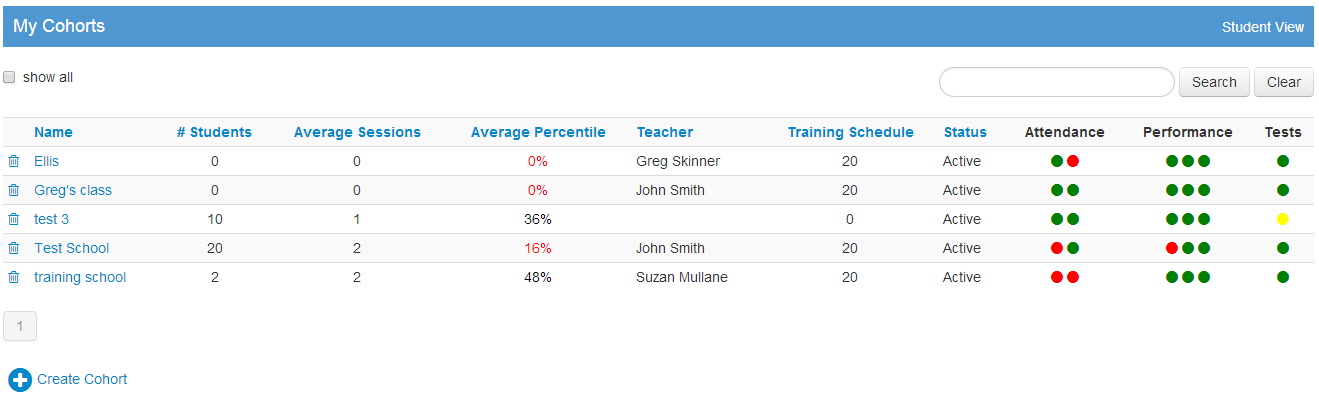
- Name of the Learning Group
- # of students – how many students assigned to the Learning Group
- Average Sessions– this is the average session the students are on in their workout schedule in the Learning Group
- Average Percentile– This is the average of the percentile ranking of all students in the Learning Group according to their grade level.
- Teacher- Creator of the Learning Group
- Training Schedule– the length of workout schedule in minutes
- Status- Active or not Active
- Progress monitoring tool– the lights work like a traffic light, the green indicates all is good, yellow is caution and red indicates a need to intervene:
- Attendance
- First light– indicates the percentage of students that have logged in the past 2 weeks.
- Second light- indicates if the Learning Group owner has logged in in the last two weeks
- Performance
- First light -indicates whether the Learning Group average progress is above 30%
- Second light- indicates the percentage of the students that have completed their session without closing their browser too early in the last 3 sessions.
- Third light- indicates that at least 30% of the Learning Group have 50% success or greater
- Tests-
- First light- indicates the percentage of students in the Learning Group that have scored lower than the 20th percentile on the NIH tests.
- Attendance
Learning Group Detail Overview:
By selecting a Learning Group and clicking on it, a teacher or instructor can manage the progress of the entire class.
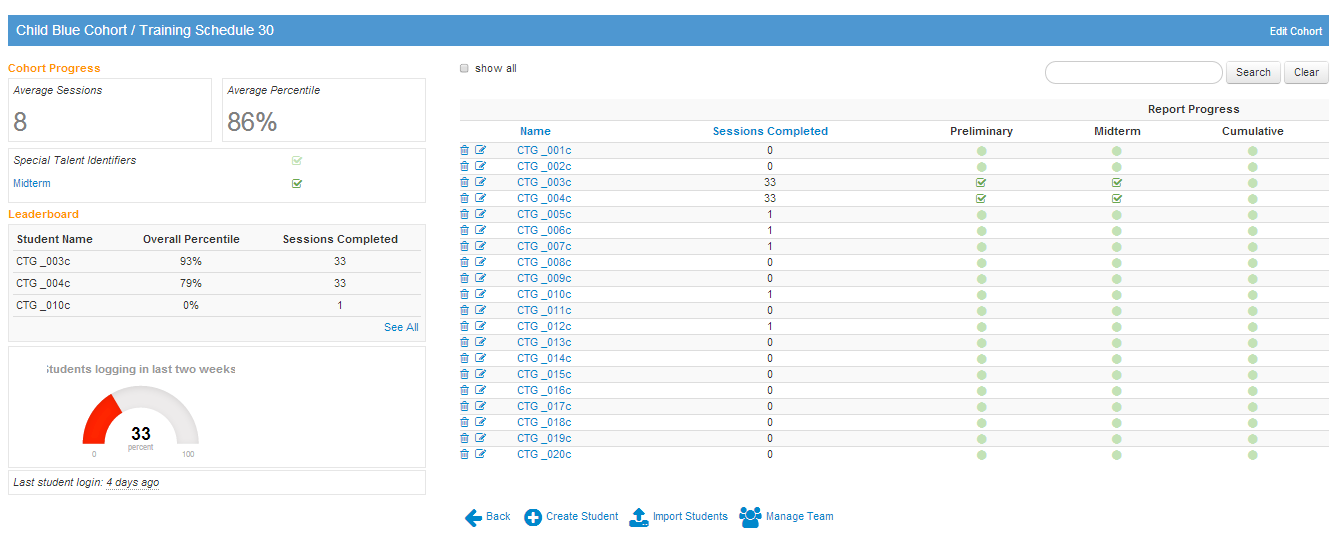
Learning Group Details View:
- Learning Group progress – indicates the average training session the group is on
- Average Percentile – Indicates the average of the overall percentiles of each student in the group
- Special Talent Identifier Report – when the box is checked the report is available. Check on the name of the report to pull and print. (more detail about the report see Reports page 13)
- Leader Board – shows who is outperforming the group in progress points and overall percentile ranking. Click See All provides you with the leaders in points on the three games as well as session played.
- Attendance Meter – Provides the attendance percentage for the group over the last 2 weeks.
- Names – These are the names of the students registered to this Learning Group. To edit the student’s password, grade level or make the student inactive click on the paper and pen icon. To delete click on the trash can.
- Session Completed – How many days they have logged in
- Report Progress – When the green circles have a check mark that indicates that the report for that student is available. Click on the check mark to pull and print the report.
Student Detail View:
To view the individual data on each of your students, click on their name.